
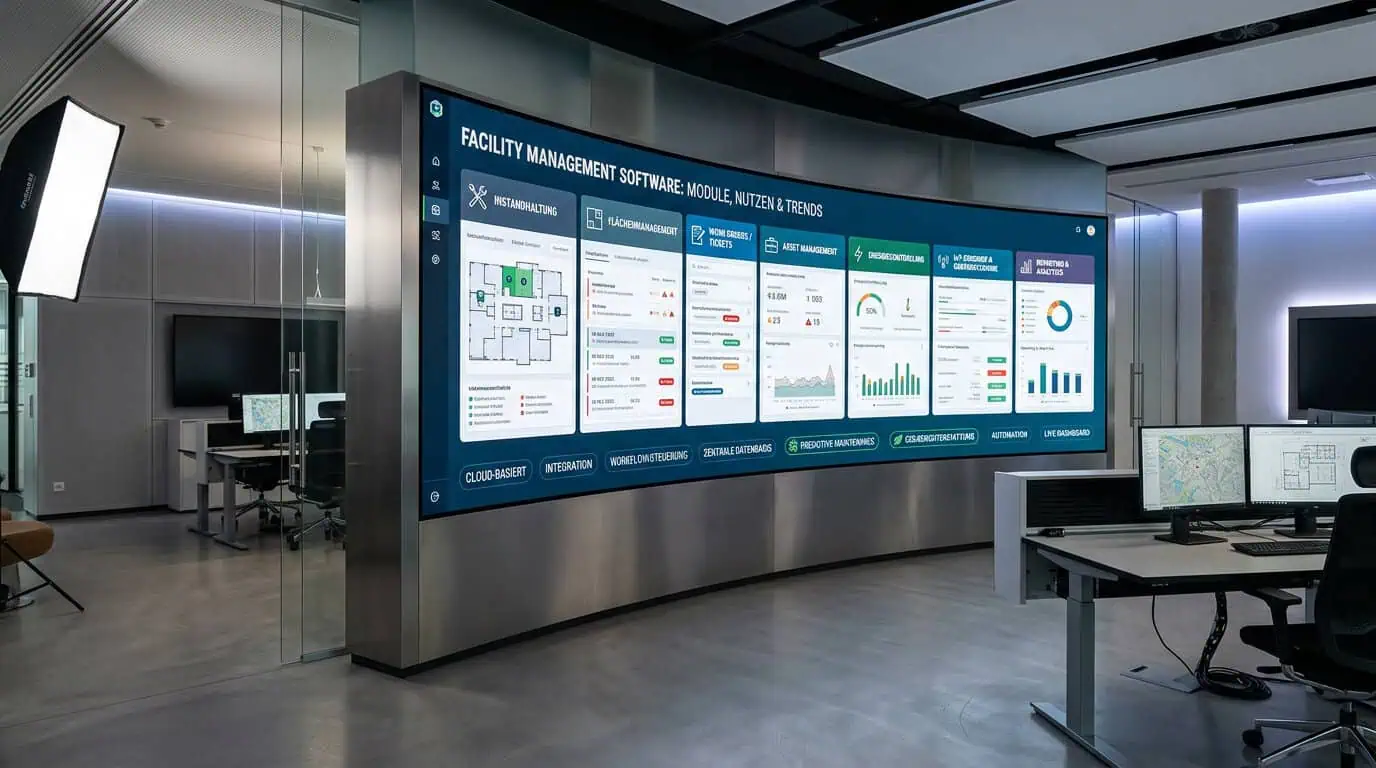
Facility management software is supposed to be able to do everything. Maintenance, space planning, energy, services. Everything at once, pleaseIn reality, however, it quickly becomes clear: it's not the prettiest interface that wins, but the platform that functions reliably in everyday use.
For FM decision-makers and IT managers, that's the real question. Which modules do I really need? Where does automation bring real benefits? And where does it all end up in an expensive Pile of half-baked master data? This is exactly what this post is about. About modules, use cases, selection criteria, and the question of how to actually derive measurable benefits from software. And I'll throw in a few buzzwords for you too (you want to shine in the next meeting, right?).
1. Asset Management and CMMS
For me, the effectiveness of CMMS only becomes visible when asset management truly functions as a central database. That means with clean master data, clear locations, and complete lifecycle data. Otherwise, you get exactly the classics that nobody misses: duplicate numbers, gaps in the maintenance plan, and costs that ultimately nobody can explain cleanly.
A good asset register accompanies the asset from procurement to disposal. This sounds trivial, but in practice, it's often ambitious enough. Only then does maintenance become more than just digitally processing tickets.
CMMS functions don't just bundle orders. They link inventory, condition recording, maintenance plans, procurement, and spare parts availability in a consistent dataset. This creates automated workflows for maintenance orders, parts orders, and condition assessments. Reactive chaos is replaced by at least a bit of predictable order.
An example from a larger office complex: the asset register included 480 light fixtures, air conditioning/ventilation components, and safety devices. As soon as a maintenance interval was due, the system automatically generated an order, checked technicians and spare parts, and updated the location upon completion. The result was pleasingly unspectacular: faster response times and a significantly more transparent cost structure. Exactly what one beforehand had wished for.
The central question is always the same: Who maintains the master data? How do ERP or BIM data get into CMMS? And who bears the governance? Without clear ownership and regular maintenance, CMMS quickly becomes a very expensive order archive with a pretty name.
- Key KPIs per asset: availability, maintenance costs per asset, condition assessment.
- Lifecycle tracking: procurement, installation, maintenance, disposal in a unified data model.
- Automated workflows: order creation upon due date, automatic parts ordering, real-time status tracking.
- Data quality as a door opener: Master data completeness, consistent location data, regular quality checks.
Without clean master data and clear governance, CMMS gets stuck in ticket mode. Only with good data quality and integration does it unfold its true benefit.
My advice: Link the asset register early with ERP and BIM data. And don't plan data maintenance as a side issue, but as a fixed part of the implementation. Otherwise, reality will surprise you later with the same elegance as a defective ventilation duct on a Friday at 4:45 PM.
2. Work Order Management and Maintenance
Work order management is the heart of maintenance. It's where it's decided whether work is completed on time, cleanly, and documented. In practice, this means: orders are automatically generated, prioritized, and assigned. Resources are planned. And the status lands live in the dashboard, so you at least know where the problem currently stands.
Too much detail creates noise. Too little detail creates follow-up questions. The art lies in structuring orders so that they remain understandable and still have enough flexibility. Otherwise, you build digital complexity, just faster.
- Define standardized order types to ensure comparability and traceability.
- Define SLA definitions and make them visible in dashboards.
- Enable mobile data capture for real-time status updates.
- Clearly assign roles and permissions to secure responsibilities and audit trails.
- Start with a pilot phase in one or two building areas.
A good practical example is a university campus with 25 buildings. There, in case of a heating failure, a priority order was automatically generated, directly assigned to a technician, and provided with a material list. The technicians reported status and arrival time via app. After a short time, response times decreased significantly, and downtimes also became shorter. This is what digital maintenance should look like. Not loud. But effective.
The core learning is simple: Without clear order types, SLAs, and clean data, automation quickly runs into a dead end. Then, efficiency is not created, but a very organized error.
ERP, BIM, and HR integration are critical here. Without interfaces, orders remain isolated, billing is difficult, and the economic benefit is halved. Or in other words: The software looks good, but operations gain nothing. Start with a clear pilot phase and measurable KPIs before rolling out the module company-wide.
3. Space and Area Management
Space and area management provides direct control over occupancy and costs. This is particularly valuable when rooms, zones, and reservations converge in a consistent model. Good software links space data with BIM and clear usage rules. Then, gut feeling finally becomes reliable space control.
However, practice often looks different. Without clean master data, clear usage types, and regular maintenance, any visualization quickly becomes pretty but expensive wall decoration. If rooms, capacities, and reservation rules are not maintained cleanly, no optimizations are created. Only new conflicts.
A multinational office location introduced desk sharing in a pilot area. The space management module showed available meeting rooms in real-time, bookings were made via app, and double bookings were automatically prevented. This seems unspectacular but saves time and nerves daily. So, exactly the currency that is rarely officially balanced in the office.
A university uses space and area management to better distribute learning and seminar spaces. Through BIM integration, course schedules and actual space requirements can be better coordinated. Unused rooms are released, new courses are entered at short notice. This saves space and creates breathing room in everyday life.
The biggest limitations remain integration with HR and ERP systems, as well as data protection. Anyone who wants to use occupancy data meaningfully needs clear governance and clean access rules. The effort is high. Training is mandatory. And without change management, the project quickly becomes a departmental graveyard with a deadline.
- Clarify data model: Clearly define occupancy metrics, rooms, zones, and booking rules.
- Define interfaces: Bring HR, ERP, and BIM data onto the same basis.
- Pilot phase with KPIs: Start small, measure occupancy rate, double bookings, and user satisfaction.
Clean occupancy data creates transparency and prevents chaos during scaling.
4. Energy and Operational Data Management
With energy and operational data management, the wheat is quickly separated from the chaff. The quality of consumption data is crucial. Clean, consolidated readings from submetering, meters, and systems form the basis for benchmarks, cost control, and compliance. Without a data model and governance, optimization suggestions unfortunately remain just pretty presentations.
Many projects fail because of this, that they want too much granularityMore measuring points do not automatically mean better decisions. They often just mean more maintenance, more calibration, and more complexity. In practice, central meters, sensible subdivisions, and clear rules are often much more helpful than trying to morally monitor every single power consumption.
An office complex with 25,000 square meters used an energy management system that collected time series per zone, automated billing, and provided monthly dashboards. Within a year, energy costs decreased by about 12 percent. Most importantly, it became visible where the largest consumers were located. This is usually the moment when "We should do something" finally turns into concrete actions.
- Benchmarking and billing: Compare actual vs. target consumption and automatically generate reports.
- Alerting and deviation management: Real-time alerts for deviations from the consumption plan.
- Potential analysis and measures platform: Identify savings potentials per zone and generate measures with ROI estimates.
For meaningful use, a clear data architecture is required. This means central energy sources, a zone concept, temporal granularity, and clear cost centers. Interfaces to ERP, BIM, and maintenance management must be standardized. Otherwise, each department will end up discussing its own truth.
The typical ROI potentials lie at 8 to 15 percent annual energy savings in the first year, provided the data basis is correct.
As always, my advice at the end of the paragraph: Start with the most critical consumers, establish a baseline, and plan a 90-day pilot phase.
5. Inventory Management and Procurement
Inventory management and procurement are not a nice extra. They are a central lever for operational efficiency. Warehousing, parts catalogs, procurement workflows, and supplier contracts are linked in a continuous data flow. This makes availability, costs, and inventory visible. Or at least less mysterious.
In practice, this only works with well-maintained master data and clear catalog structures. Otherwise, even the best automation fails due to incorrect parts lists, flawed supplier master data, and inconsistent order texts. The finer the inventory data, the higher the maintenance effort. This is the small irony of this discipline: more structure means more discipline.
A medium-sized property management company linked its inventory management to a central procurement system, used barcode scanners for incoming goods, and an automated approval workflow. After nine months, inventory levels decreased by 25 percent, procurement costs per order by 12 percent, and delivery time shrank from five to three days. This is rarely spectacular. But it is very pleasant economically.
- Data model and master data quality: Clearly assign inventory, part numbers, and storage locations.
- Integrations: stable interfaces to ERP, BIM, and HR systems.
- Process automation and governance: Set up order triggers, approvals, supplier portals, and audit trails cleanly.
A pilot project in a clearly defined building area is almost always the better choice here. Test the entire process from goods receipt to procurement. Measure KPIs. And adjust the data structures before you roll it out extensively and later wonder why no one uses the same material number.
6. Facility Service Management and Workplace Services
The core principle of this module is service-oriented processing outside of core maintenance. It controls SLAs, cleaning and security services, as well as technical services via portals, tickets, and mobile apps. This also includes desk management, room allocation, and internal moves. In short, everything that is constantly urgent in everyday life but rarely adequately prepared.
Without clearly defined service catalogs, standard SLAs, and escalation paths, the whole thing quickly becomes a black box. Users, cleaning staff, technicians, and security personnel need the same framework. Otherwise, duplicate work, delays, and frustration arise. This is precisely the kind of digitalization that generates more follow-up questions than it solves.
- Clarify service catalog and SLAs: define standardized services with response times and escalation paths.
- Self-service portals increase acceptance: capture requests yourself, track status, automate standard processes.
- Escalations, reports, and dashboards: clear rules, regular reports, and transparency for FM and owners.
In a German office complex with three locations, a service management module was introduced. Through a self-service portal for cleaning and maintenance requests plus defined SLAs, service level fulfillment increased significantly. At the same time, telephone inquiries noticeably decreased. In six months, response times improved by about a third. And the first-time-fix rate increased because recurring problems were handled cleanly via the portal instead of getting lost in email loops.
The biggest hurdles lie in building the knowledge base, training users, and maintaining data quality. Without ongoing change management, you will miss ROI targets, even if the technology is sound. A small, iterative rollout is usually smarter here than a big bang, which ultimately only produces one thing: more questions. Overtime.
Integrations with ERP, HR, and access control systems are crucial. Only then can response times be realistically shortened, personnel availability be correctly planned, and costs be accurately allocated. And yes, exactly: security and data protection aspects must not be neglected. Role-based access, logging, and data protection-compliant ticket retention are mandatory in Germany and not an optional extra.
