
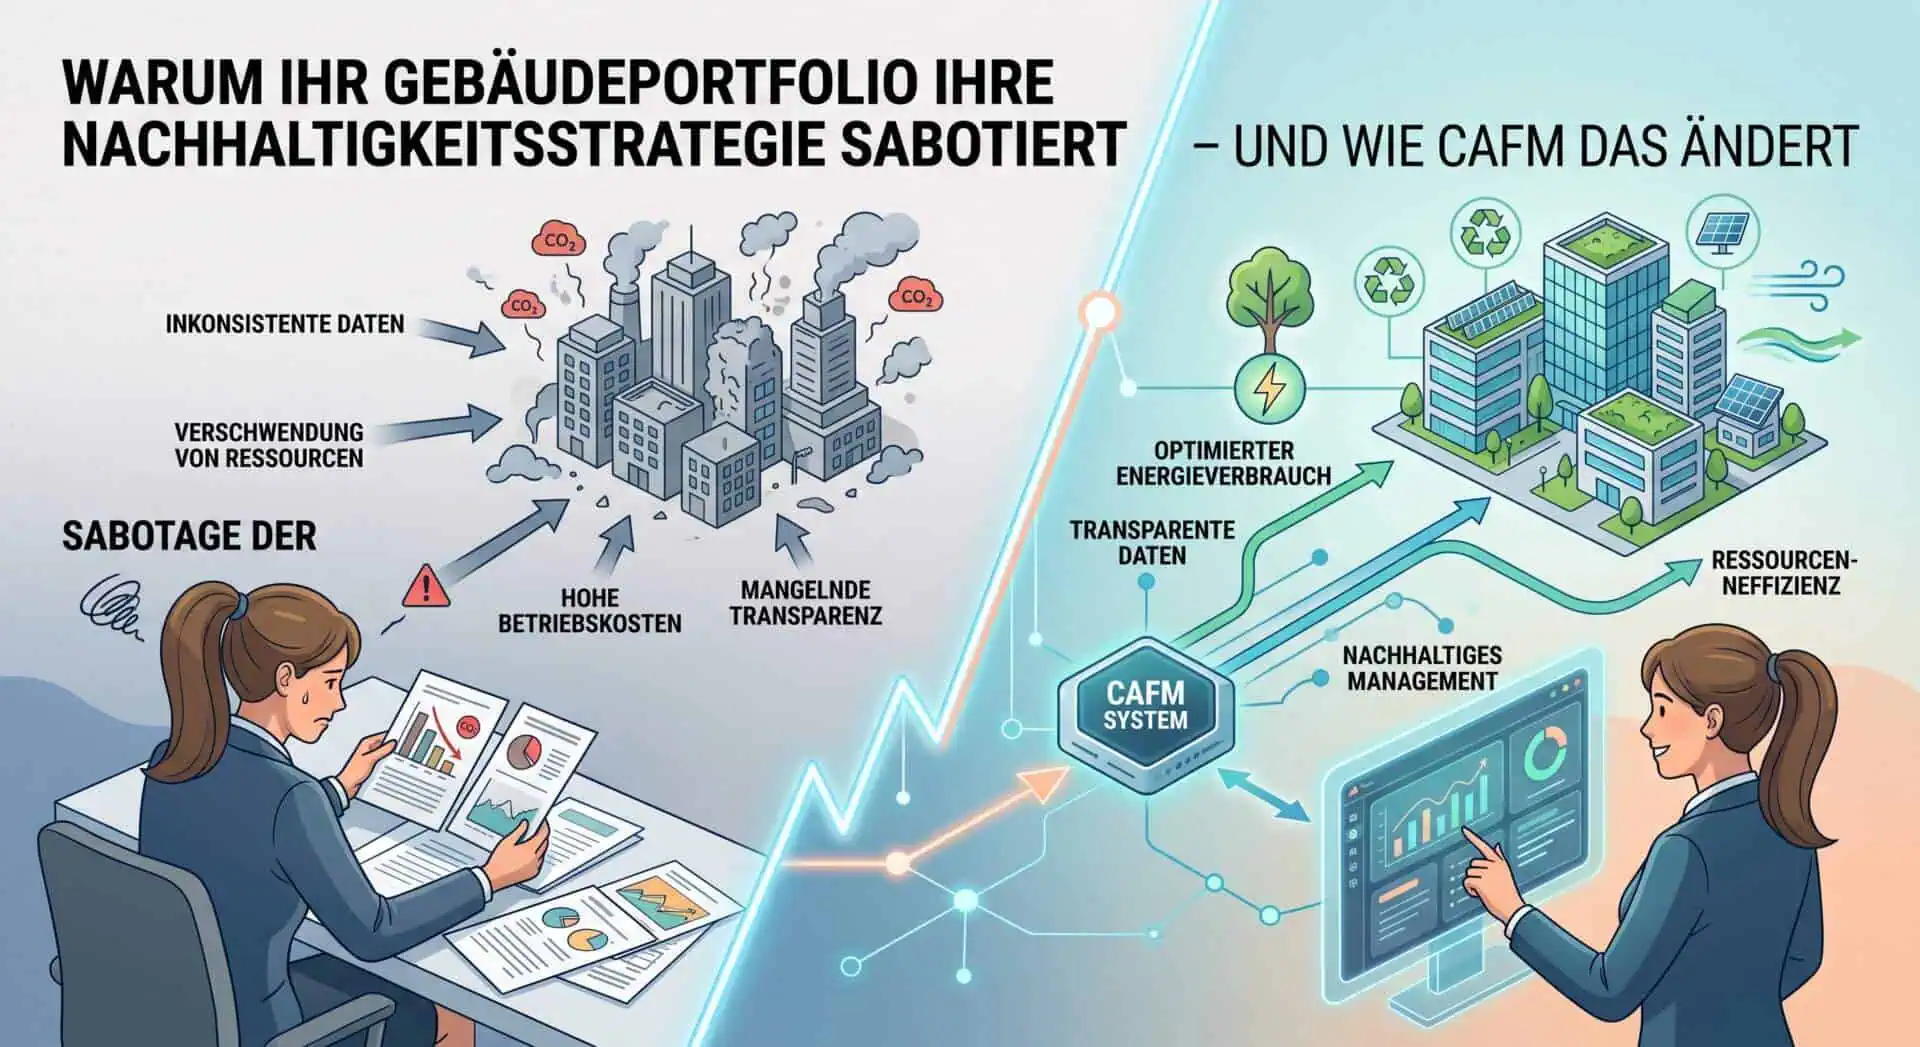
Your building portfolio directly influences your sustainability – usually simply, without you noticing. Executive Floor it. Fragmented data, turf wars between real estate, IT, and operations, as well as fantasy key figures, sabotage ESG reports more reliably than any power outage. A CAFM system should provide a remedy as a central data platform. I will show you very simply how to clear up the chaos without dying beautifully.
1. The Built Portfolio: The Hidden Stumbling Block
When location distribution and usage types are a free-for-all, energy consumption, emissions, and maintenance simply don't speak the same language. Even well-intentioned goals hit a wall because no one knows which key figure comes from which Excel Hell source.
A practical example: A German corporation operated 28 locations. The data came from three systems, and the ESG deviation was a cheerful 12%. Only with a central CAFM data platform did the error shrink to less than 3% – and the report even arrived on time.
-
Problem: Isolated data silos due to rented and owned spaces.
-
Solution: A lean taxonomy and clear data owners (buzzword of the day: Data Owner.
-
Conclusion: Those who forget their homework on governance before buying software often just buy a very expensive dashboard without much content.
2. CAFM as a Data Therapist for Silos
A CAFM system only makes sense if you feed it the right data. Instead of hoarding data like supplies for the apocalypse, energy, system status, tenant data, and maintenance contracts flow together here.
-
The core ingredients: energy meters, system status, occupancy rate, lease agreements, and clean master data.
-
The practical effect: A portfolio of 12 buildings reduced its ESG reporting time from days of paperwork to under a day per quarter. CO2 transparency included.
3. From paper tiger to reporting in 4 phases
Sustainability rarely fails due to a lack of willingness, but mostly due to Action. A pragmatic 4-phase plan helps:
-
Phase 1 – Target state & asset taxonomy: Assign unique object IDs and define KPIs. Sloppiness here leads to comparing apples and oranges later.
-
Phase 2 – Data detox: Unify units, delete duplicates. Data cleansing is the unglamorous gatekeeper of success.
-
Phase 3 – The test fire (pilot project): Take 2-3 typical buildings, test for six months. In an office pilot, energy intensity often drops by more than 10% just through targeted load control.
-
Phase 4 – Rollout & soul massage (change management): Turn those affected into participants. Without clear data stewards, you're just building a pretty diagram graveyard.
4. The KPI Framework: No More Fantasy Numbers
A KPI framework connects hard energy consumption (“€ per kWh/sqm”), CO2 emissions, and utilization directly with the portfolio.
-
Integration: Merge meters, maintenance logs, and tenant data into a common view.
-
The trap: You obsessively optimize a single key figure and are surprised when costs explode elsewhere. Master Data Management protects against this blind flight.
5. Practical View: How Others Do It
Well-known platforms such as Planon, Archibus, speedikon or RIB FM show with numerous clients how it works: centralization dramatically accelerates approvals for green investments. However, the added value rarely lies in the colorful software interface, but in the tedious discipline of data maintenance.
6. Regulations in Germany: EU Taxonomy & Bureaucracy Jungle
The EU Taxonomy, ISO 41001, and CSRD reporting requirements no longer tolerate estimated values. Data must be auditable.
-
Funding: There are government funds for digitalization in facility management. The only catch: funding requirements bring even more reporting obligations.
-
Role distribution: Real estate, IT, and sustainability officers must pull together – in the same direction.
FAQ: The most important points at a glance
-
How does fragmentation sabotage ESG goals? If building A measures in liters, building B in kWh, and building C not at all, the report becomes pure nonsense.
-
Which KPIs really count? Energy intensity, CO2 equivalents, water consumption, space utilization, and maintenance backlog.
-
The biggest pitfall? The belief that software alone will heal organizational chaos.
Define data ownership, choose five core KPIs, start with a small pilot area – and don't leave the rest to chance.
